*Excel was being weird and I couldn't figure out how to add a label, but radius is plotted in dB if that wasn't obvious
02-24-2025
I spend alot more time then I care to admit window shopping on facebook marketplace. There are tons of great quality vintage hi-fi speakers, but to my dismay, many have badly dented or damaged dust caps. Of course many audiophiles make plenty of anecdotal claims, (most?) claiming it has no affect on sound, but I find that hard to believe. And as far as Ive looked, I cant find anybody who has actually bothered to measure this (though if anybody is aware, do let me know). But, as a student, I just so happen to have access to a whole bunch of testing equipment, so lets give it a try
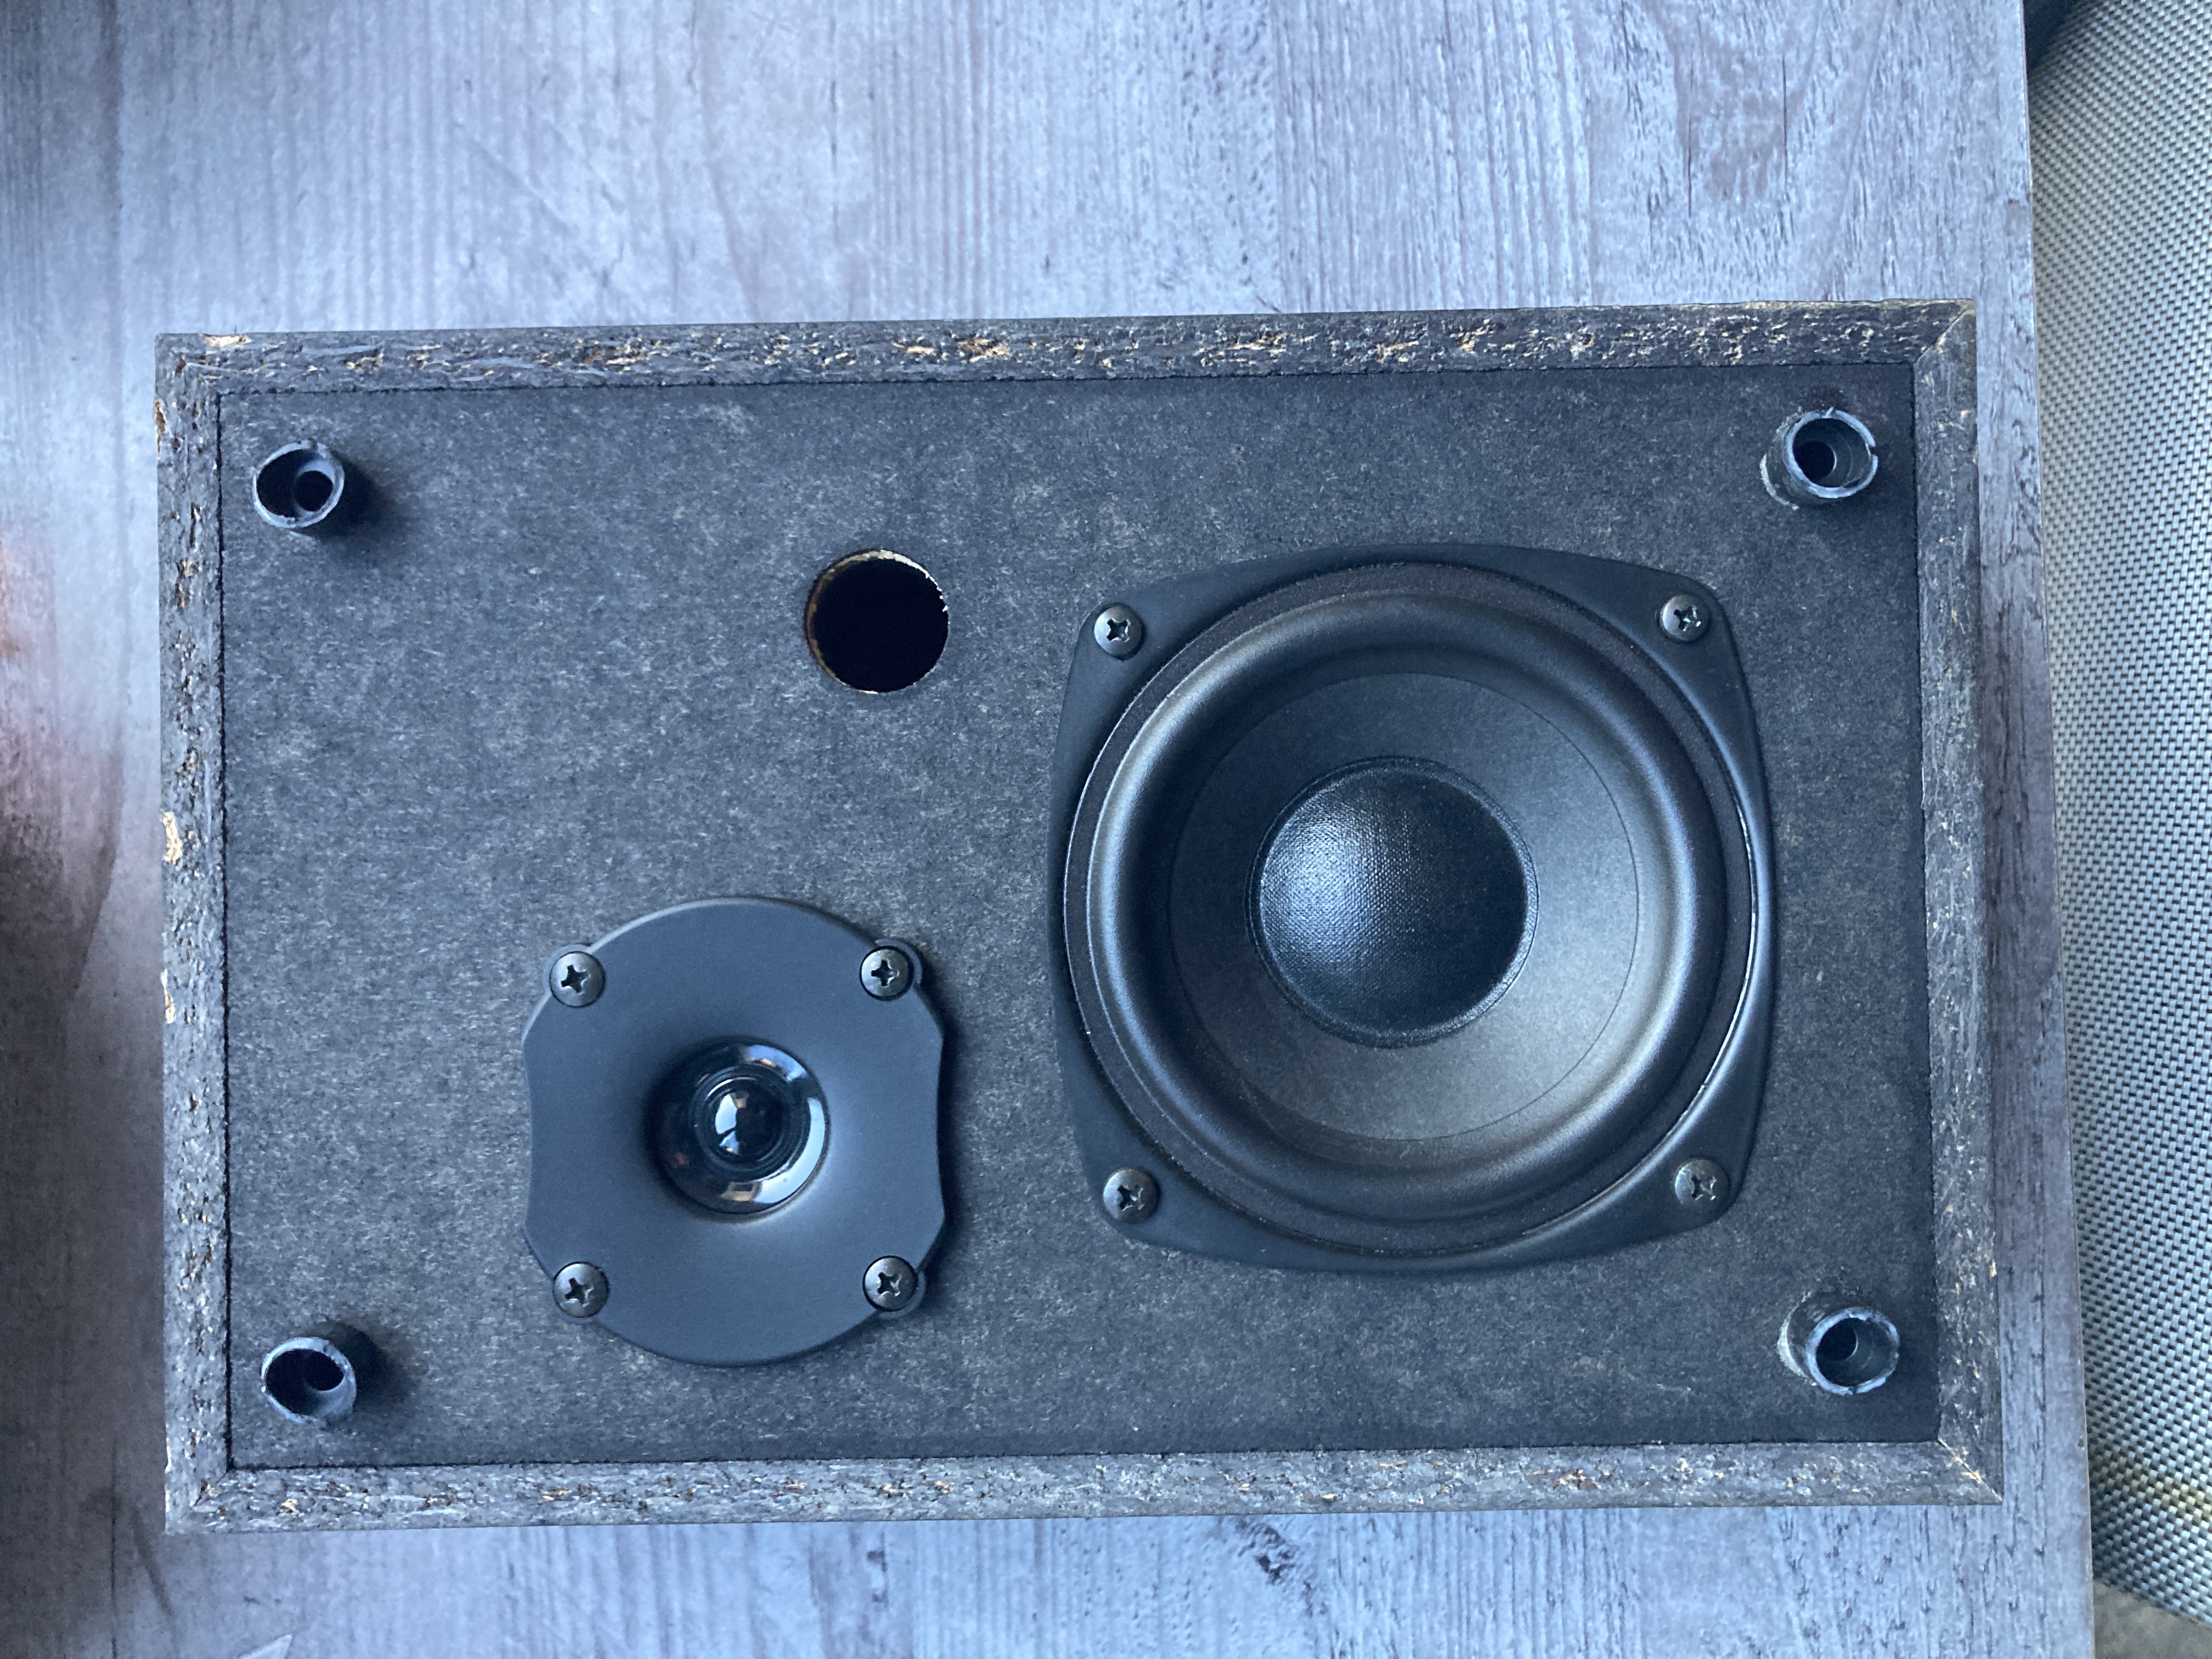
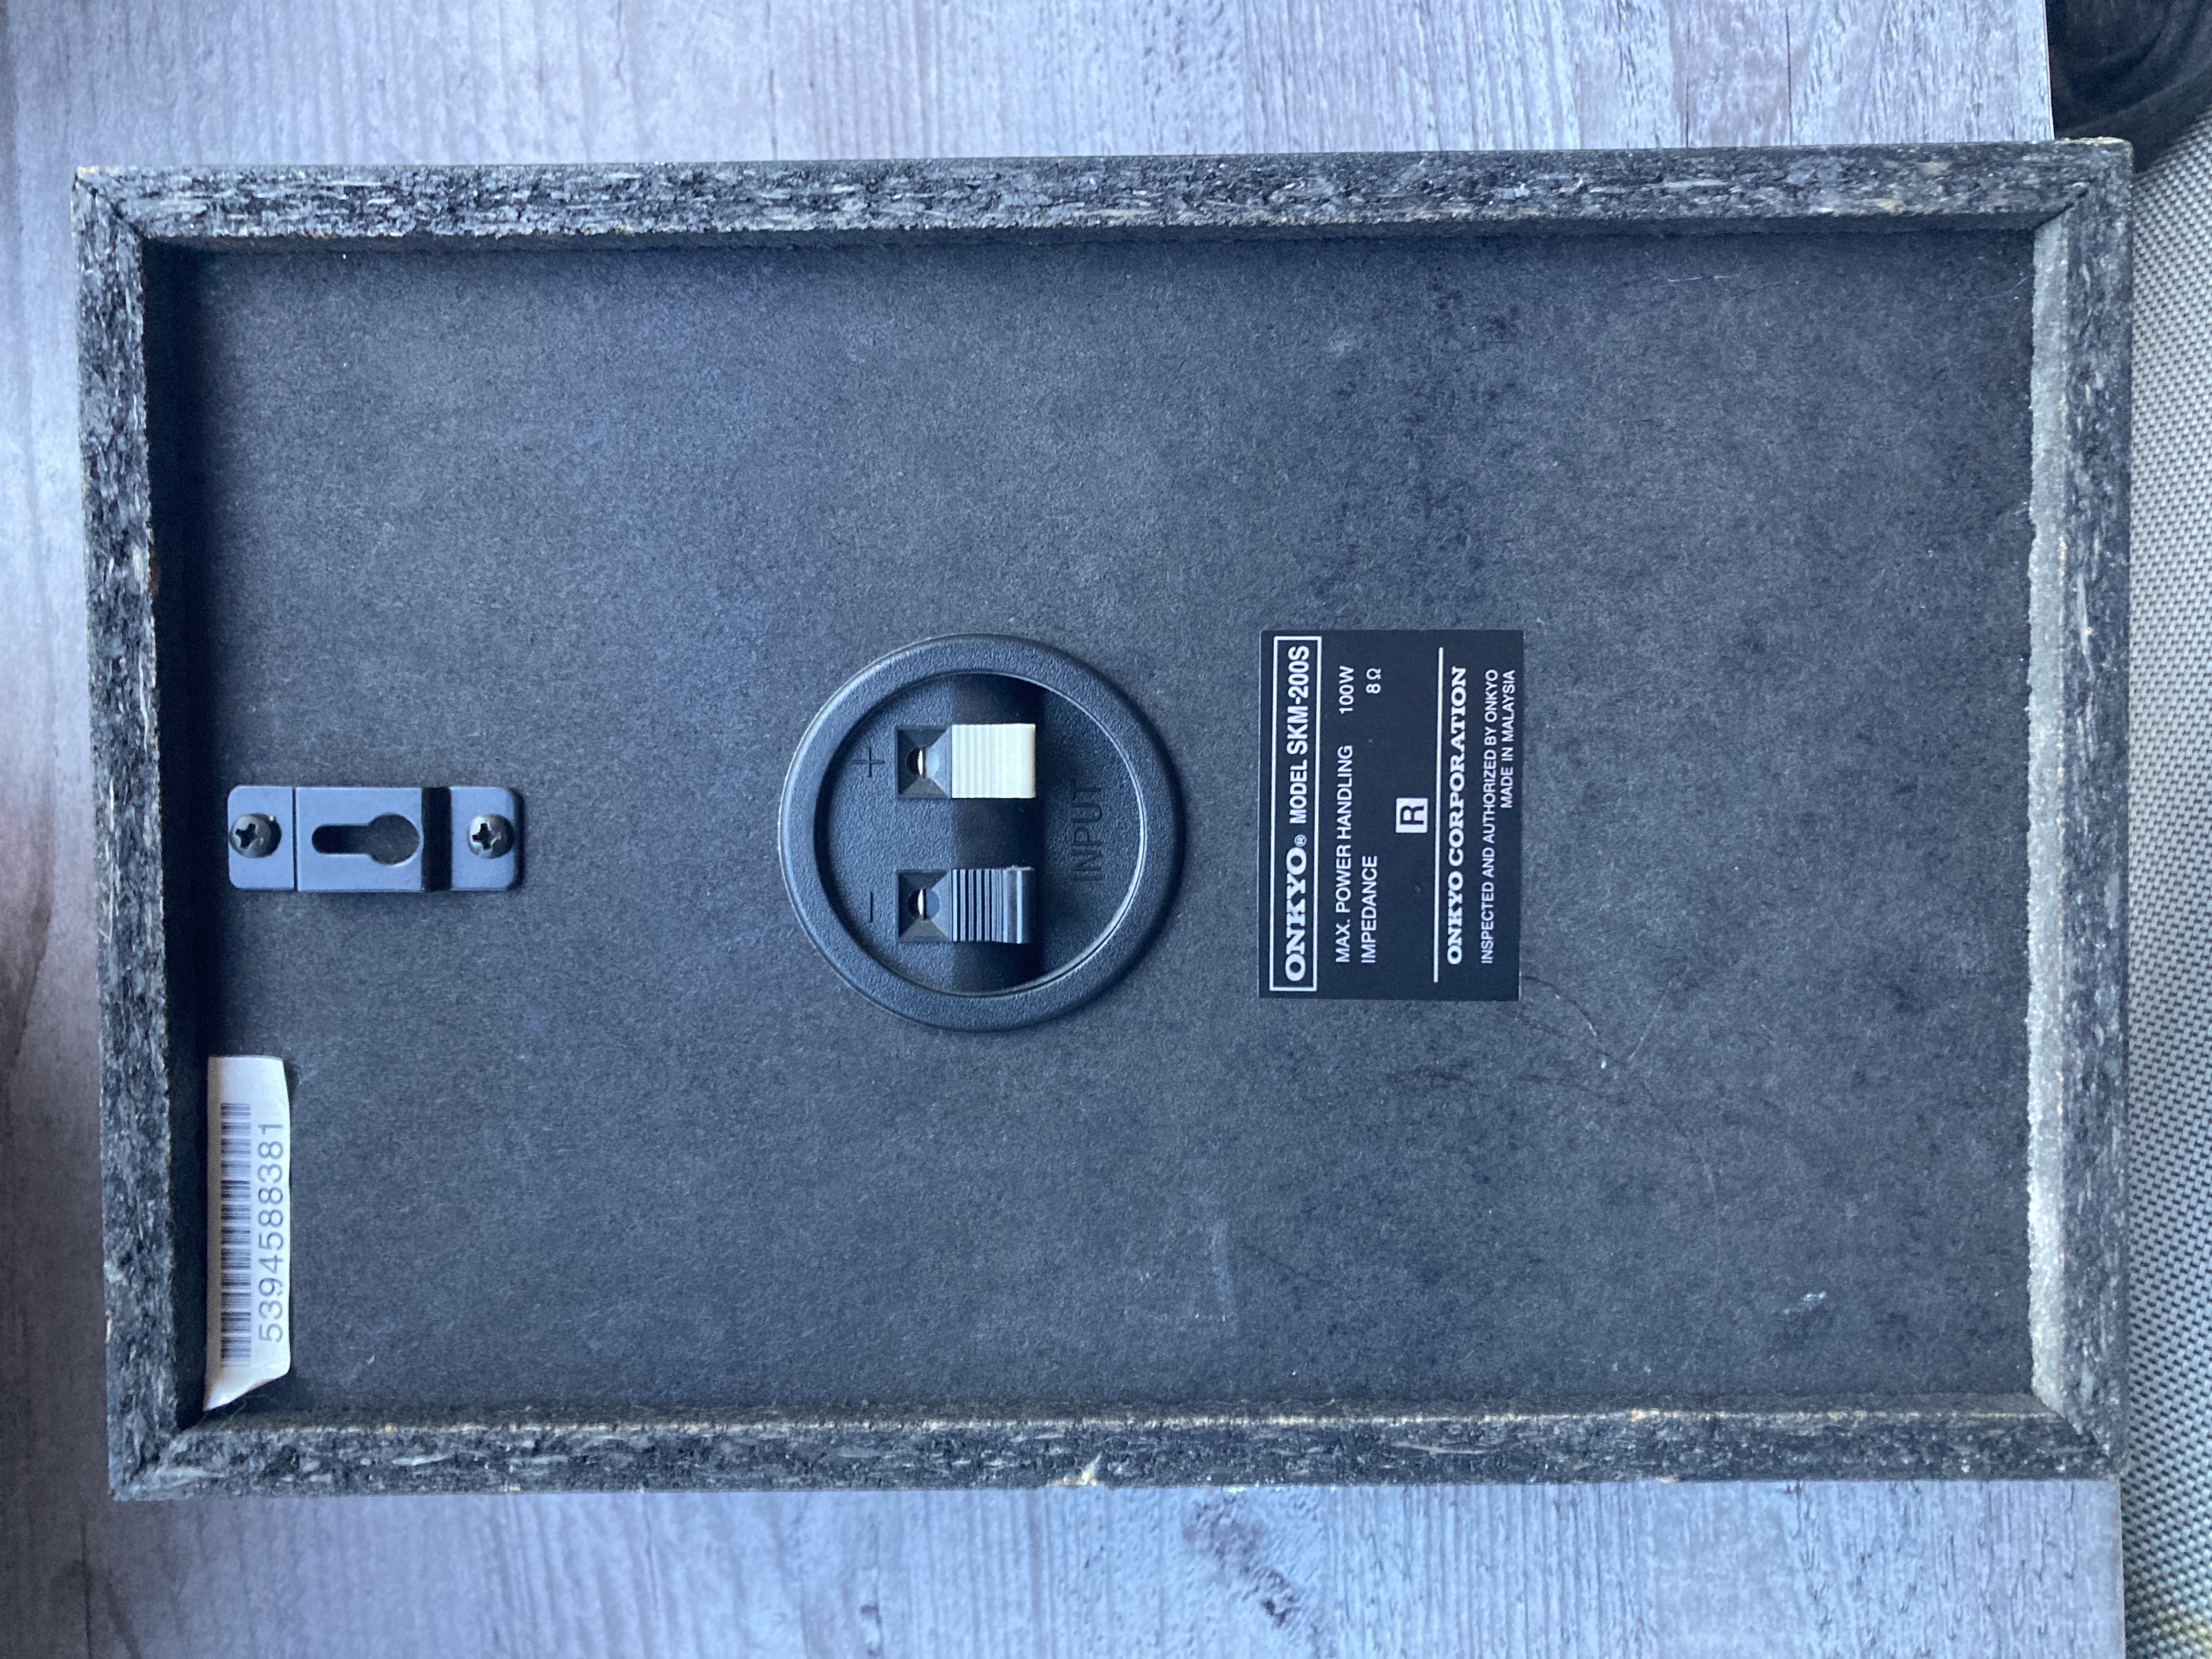
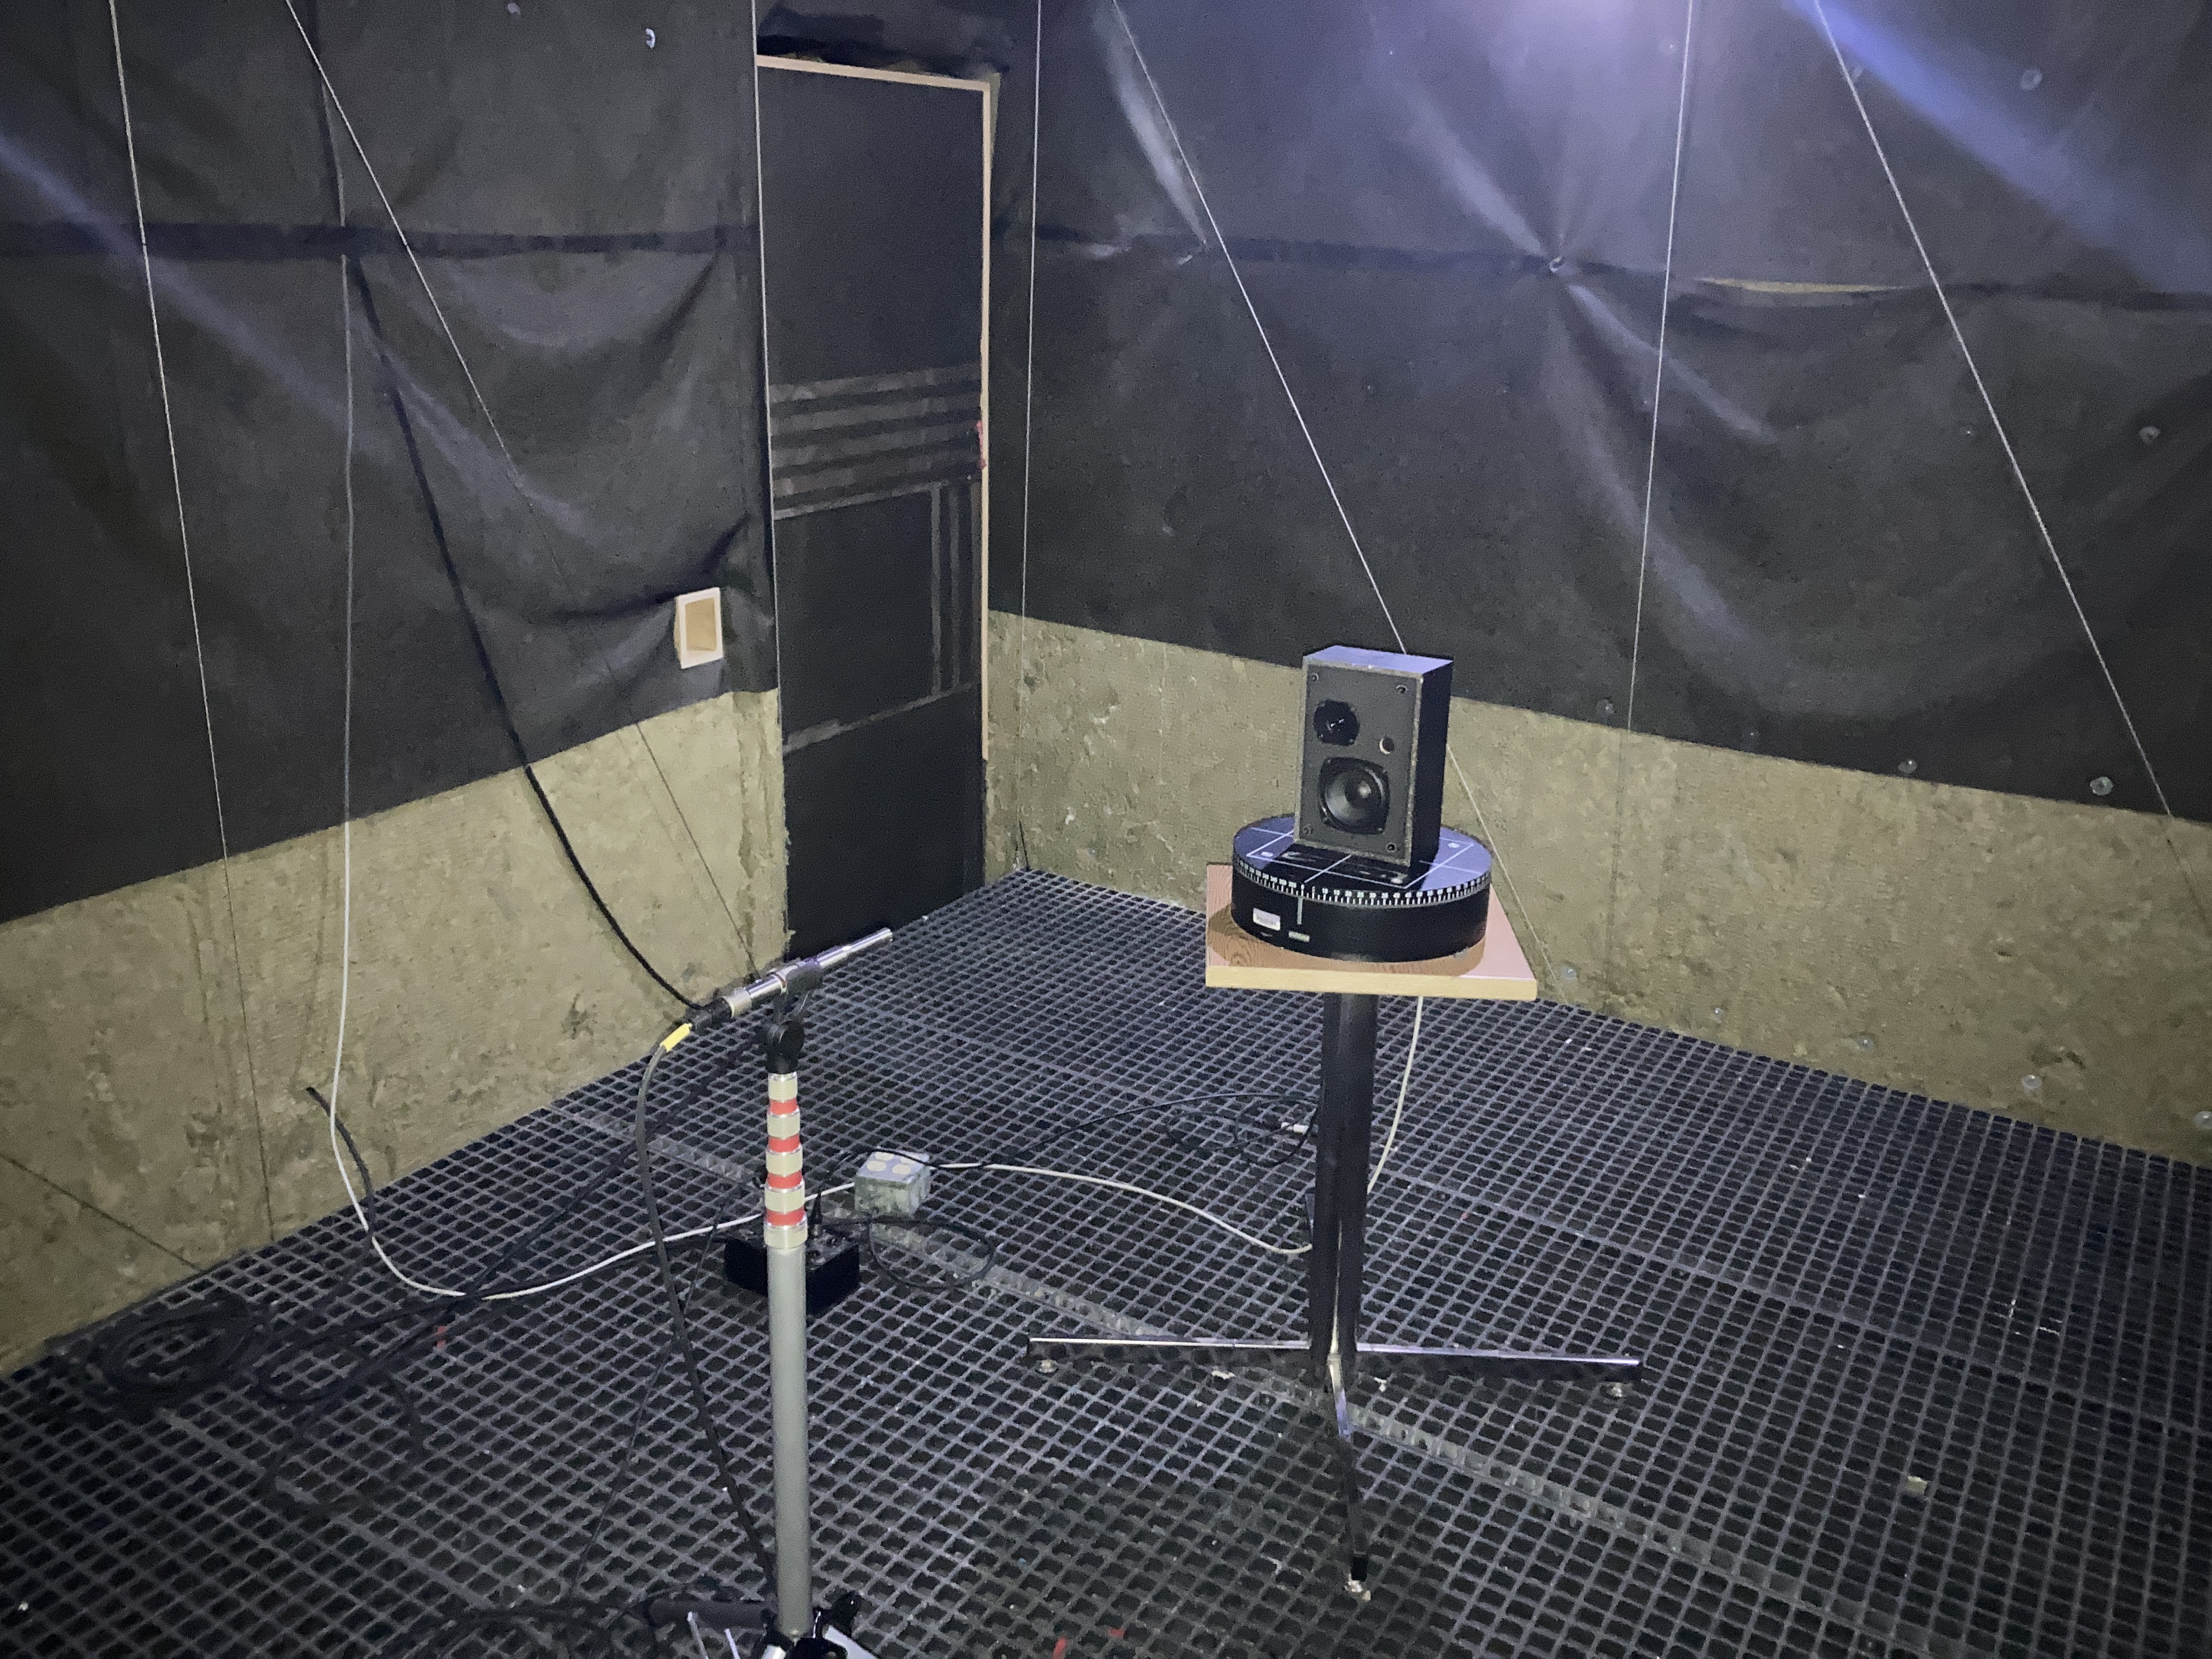
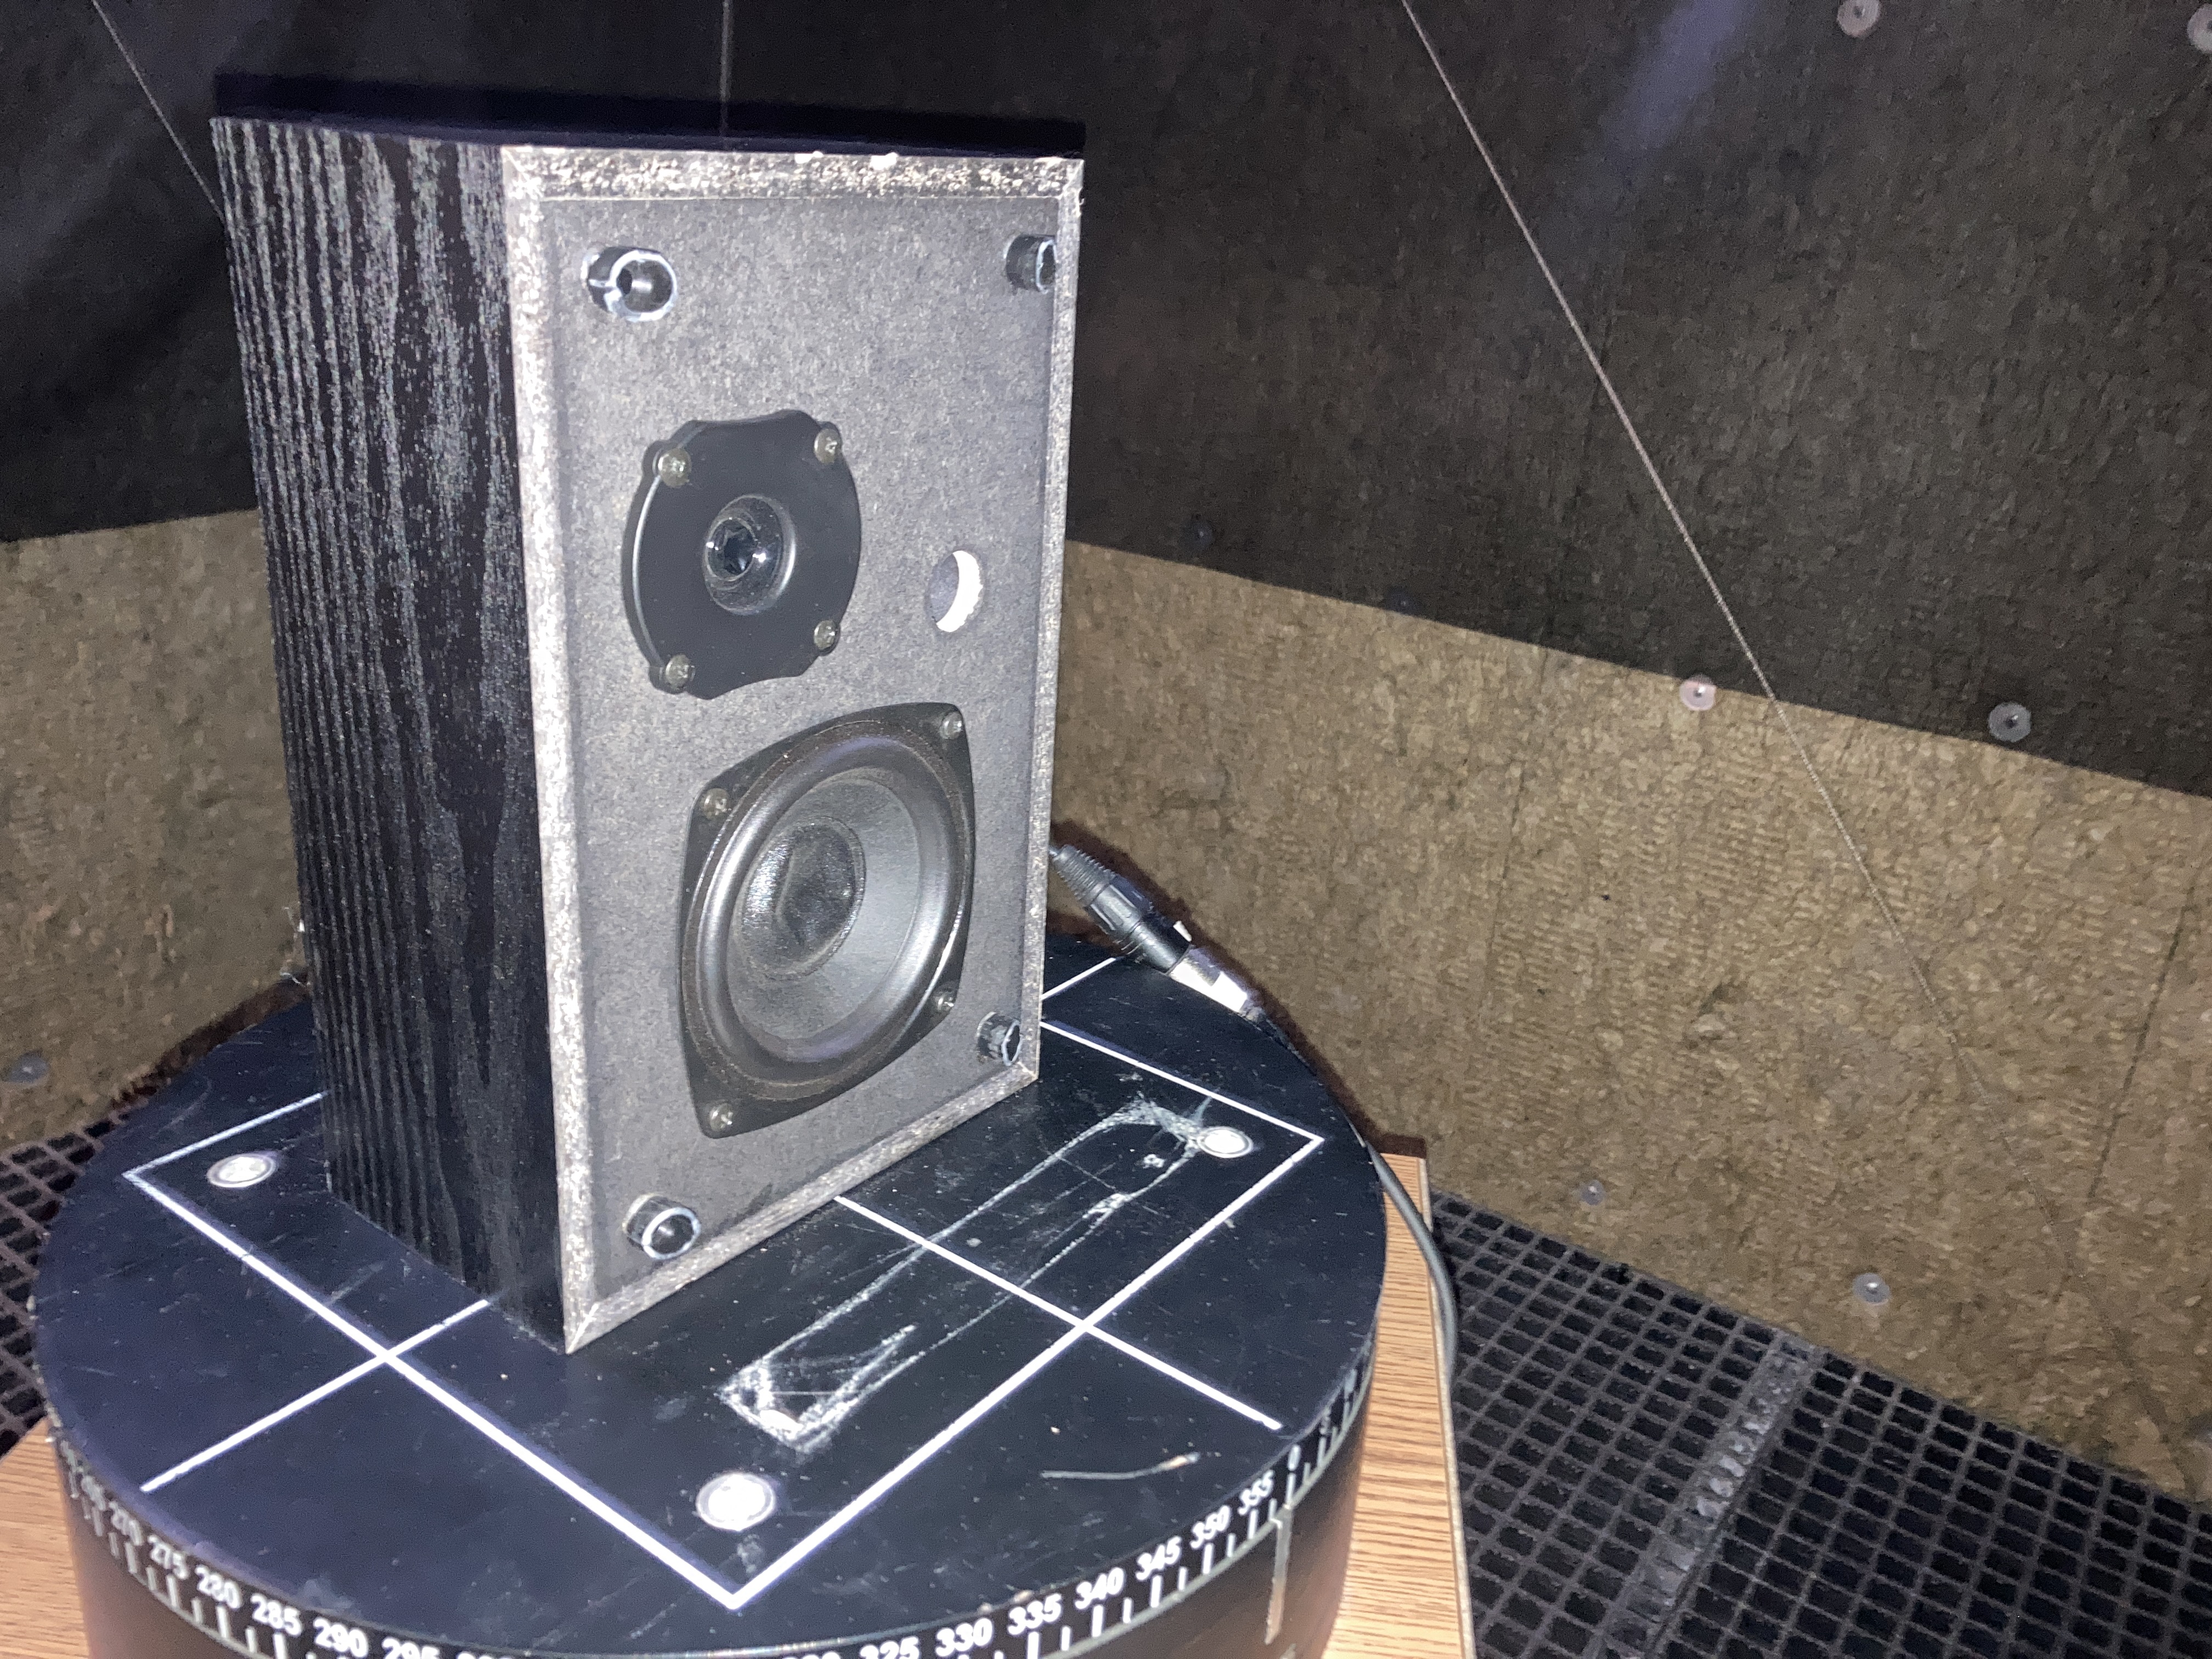
All testing was done in an anechoeic chamber to avoid reflections impacting testing, measured at a distance of 1m, 85dB (see note). For choice of speaker, I went to a local thrift store and selected the cheapest speaker I could find that wasnt already damaged. I landed on the Onkyo model SKM-2000S (100W, 8Ω). I chose to do all measurement in REW, and then compile the data in excel. While I have acces to gold-line's TEF software that will automatically make polar plots, its pretty outdated by todays standards, and is windows only, so I cant export the files onto my personal MacBook. None of the equipment was calibrated, but since I'm focusing on comaprison measurements, it won't really matter.
Before I get into the results, I encorage you to take a listen to the before and after music samples, to try and hear if theres a noticible difference for yourself
Google drive link (Neocities doesn't allow .wav or .mp3)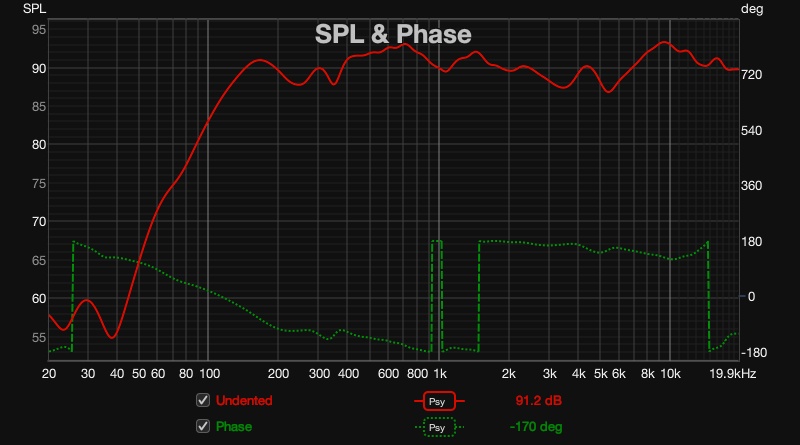
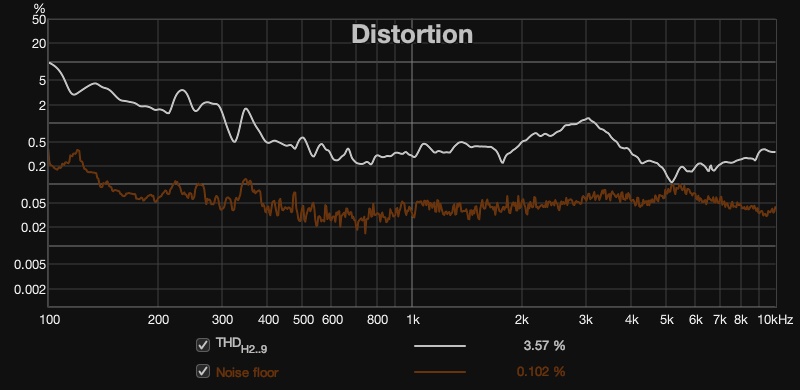
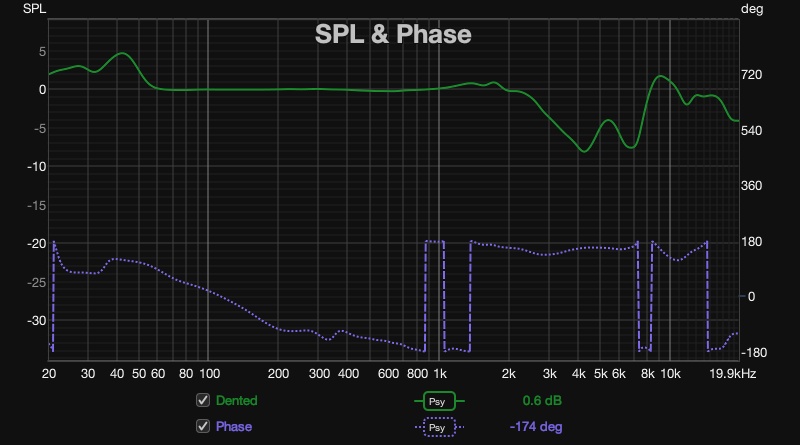
An overall better response then I would have expected. I dont see any major cross-over artifacts either. This speaker doesn't have a proper RCL cross-over and instead has a single filter capacitor. Distortion also looks suprisingly good, with distortion staying mostly under 1% above 300Hz
*Excel was being weird and I couldn't figure out how to add a label, but radius is plotted in dB if that wasn't obvious
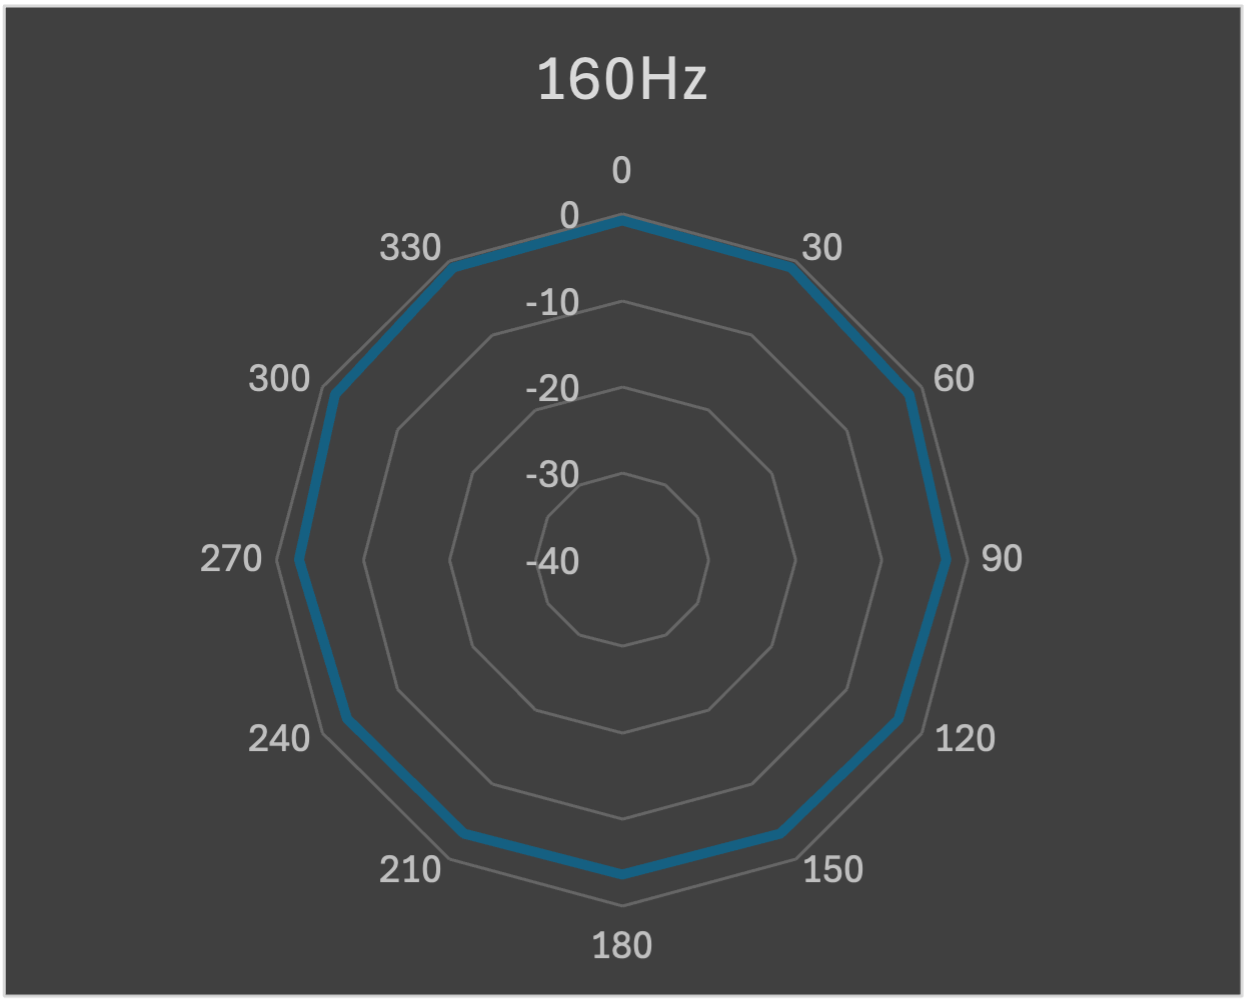
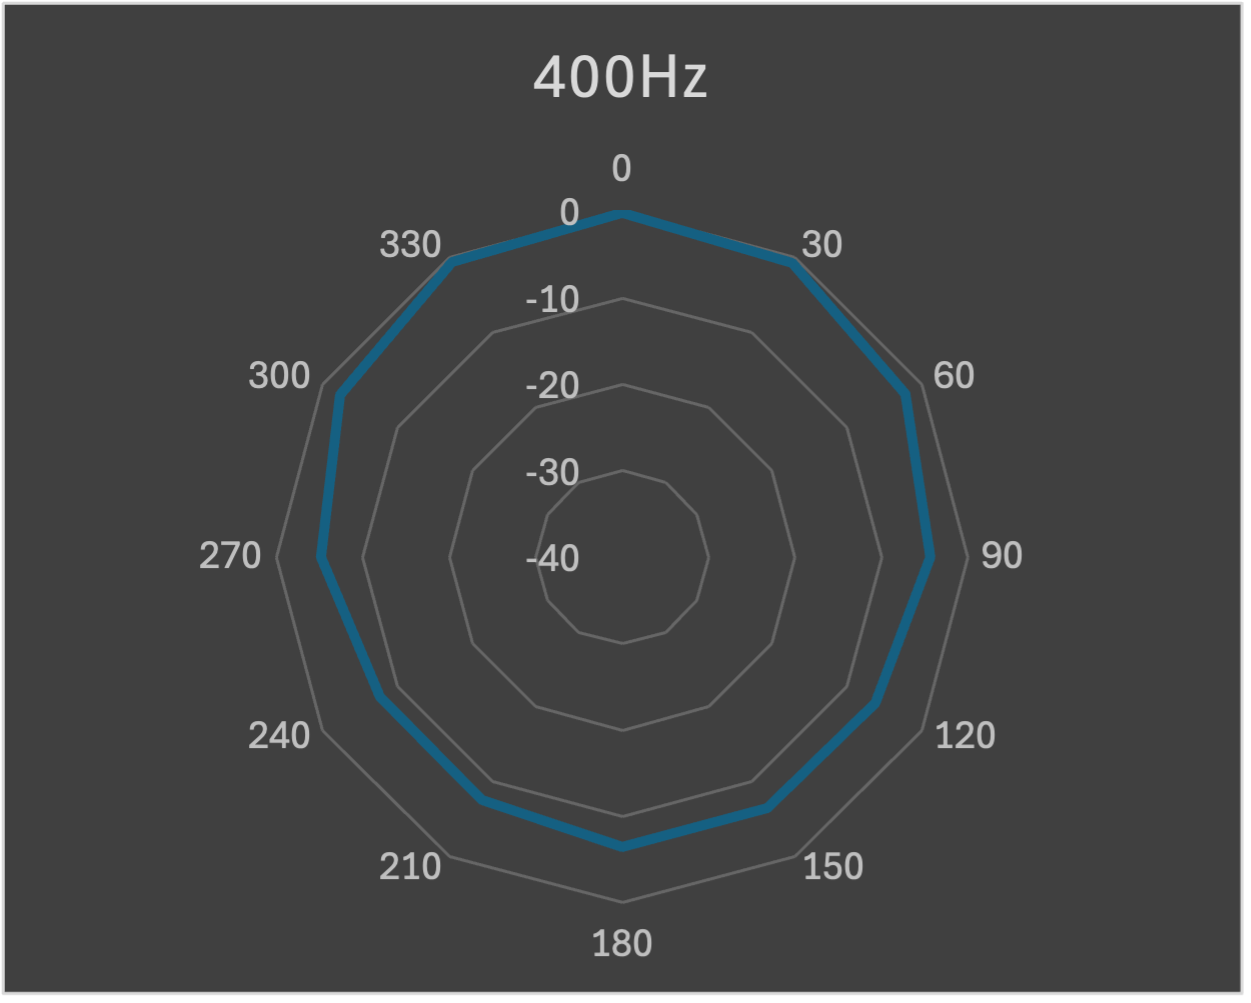
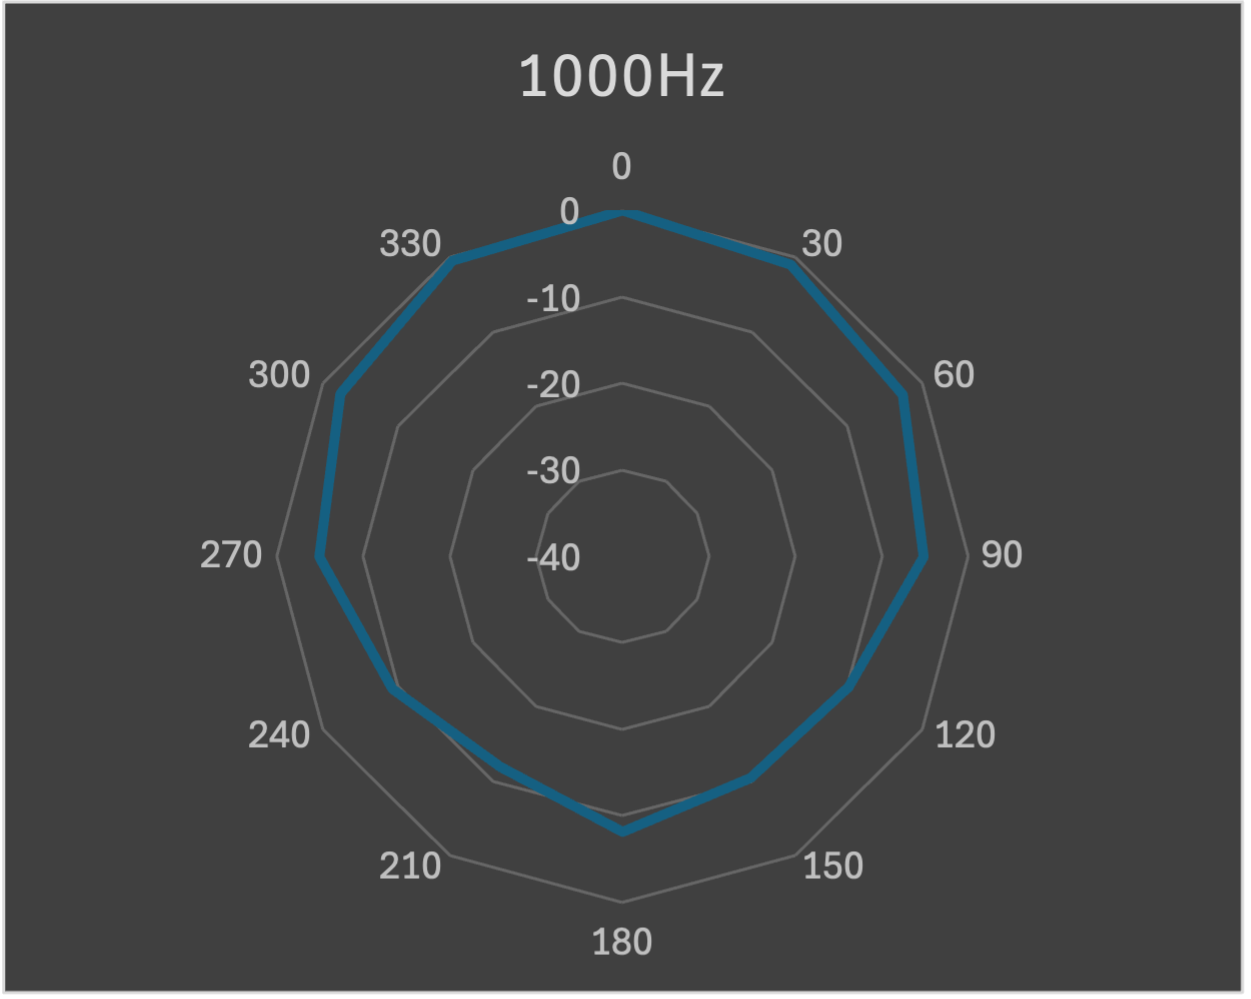
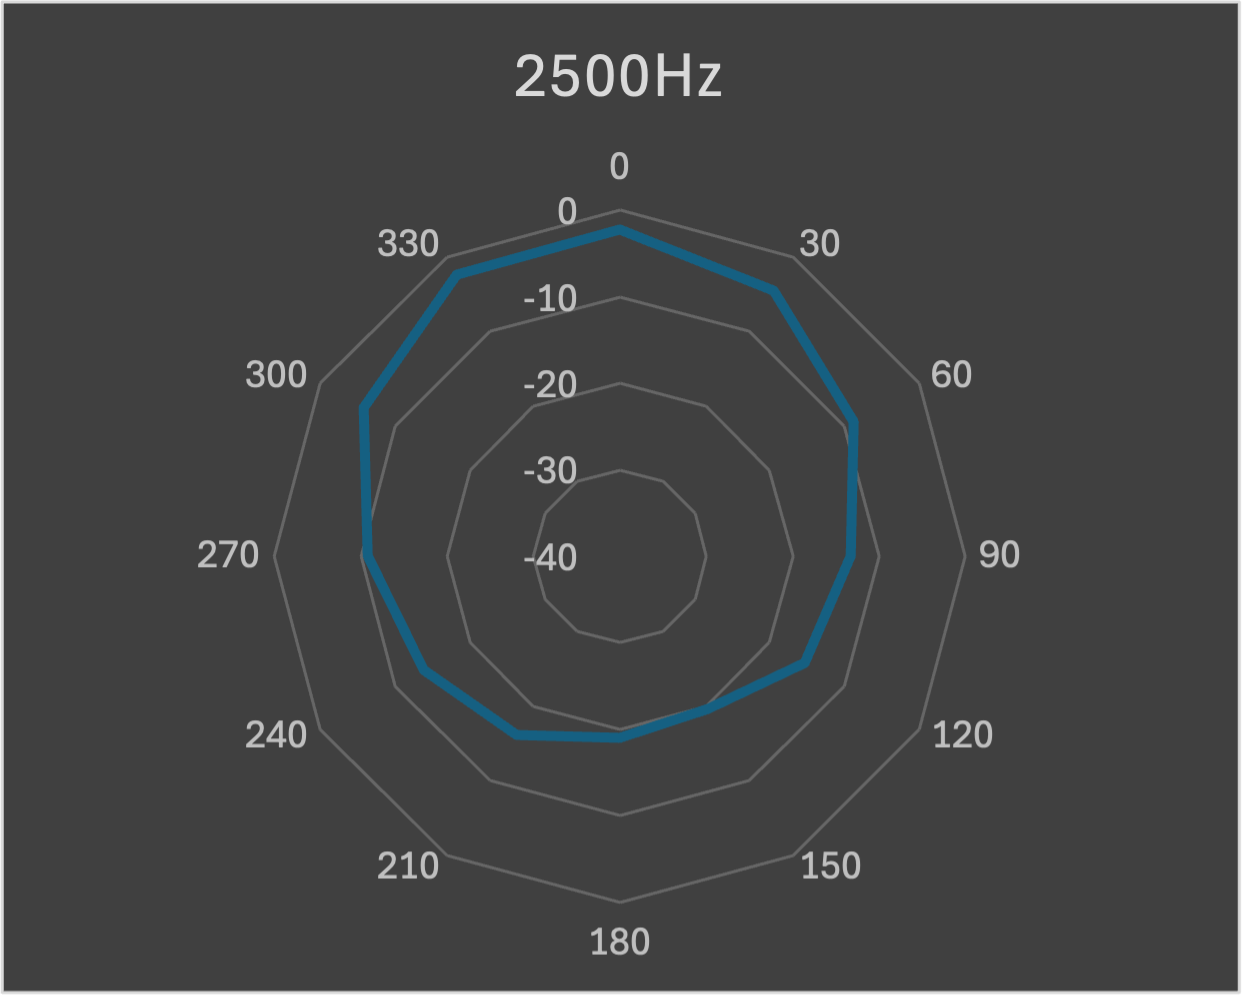
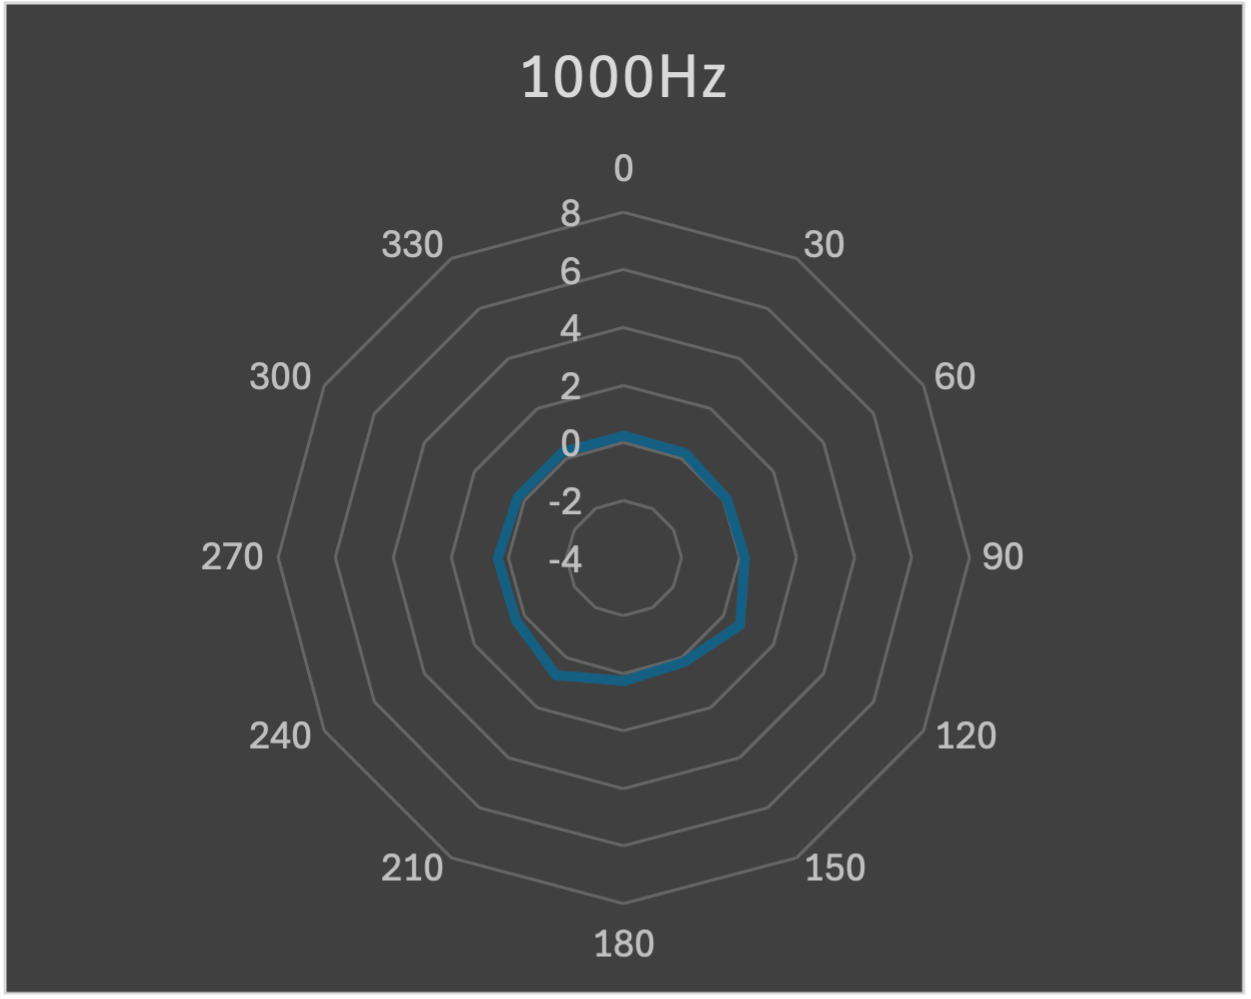
Nothing earth shattering here, omni-directional at lower frequencies, then becoming more directional going up the frequency spectrum.
Note that all data is normalized with respect to the first test, so were only looking at the differences between the two, rather than any absolute values.
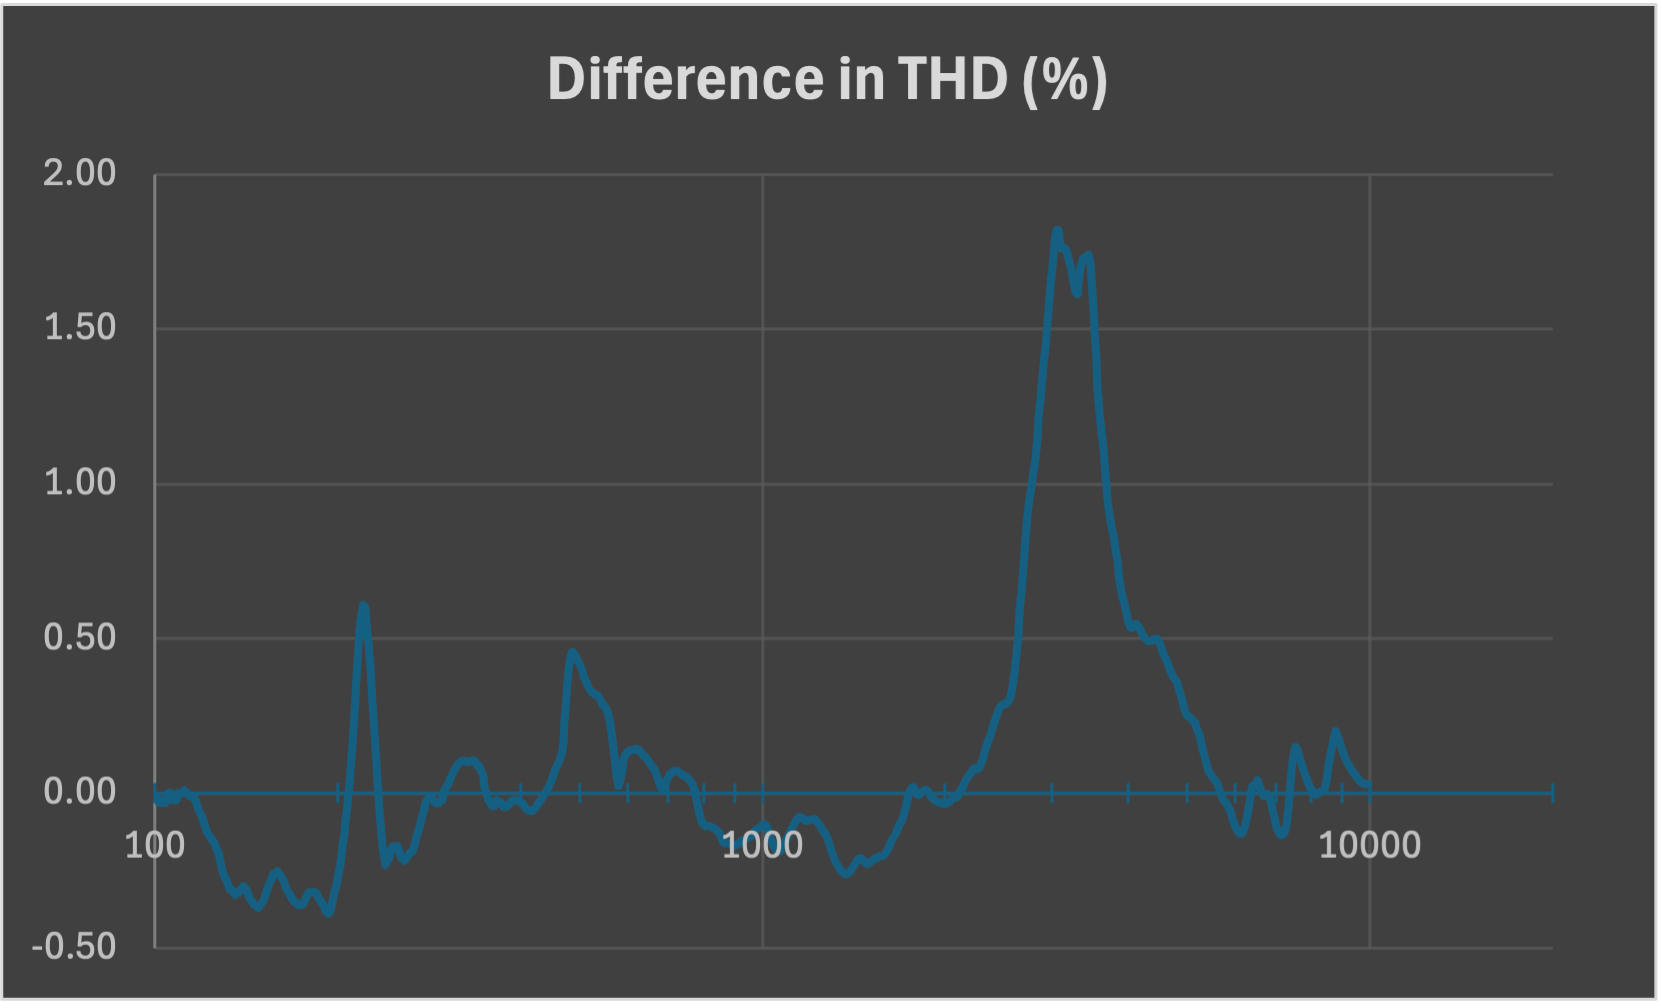
The dented woofer made absolutely no difference in frequency response, and a very little increases in distortion. We do see pretty major increases in distortion to the tweeter however. While not extremely noticible, I do feel the difference is audible in the music demos
Same thing here, data is normalized to show only the differences.
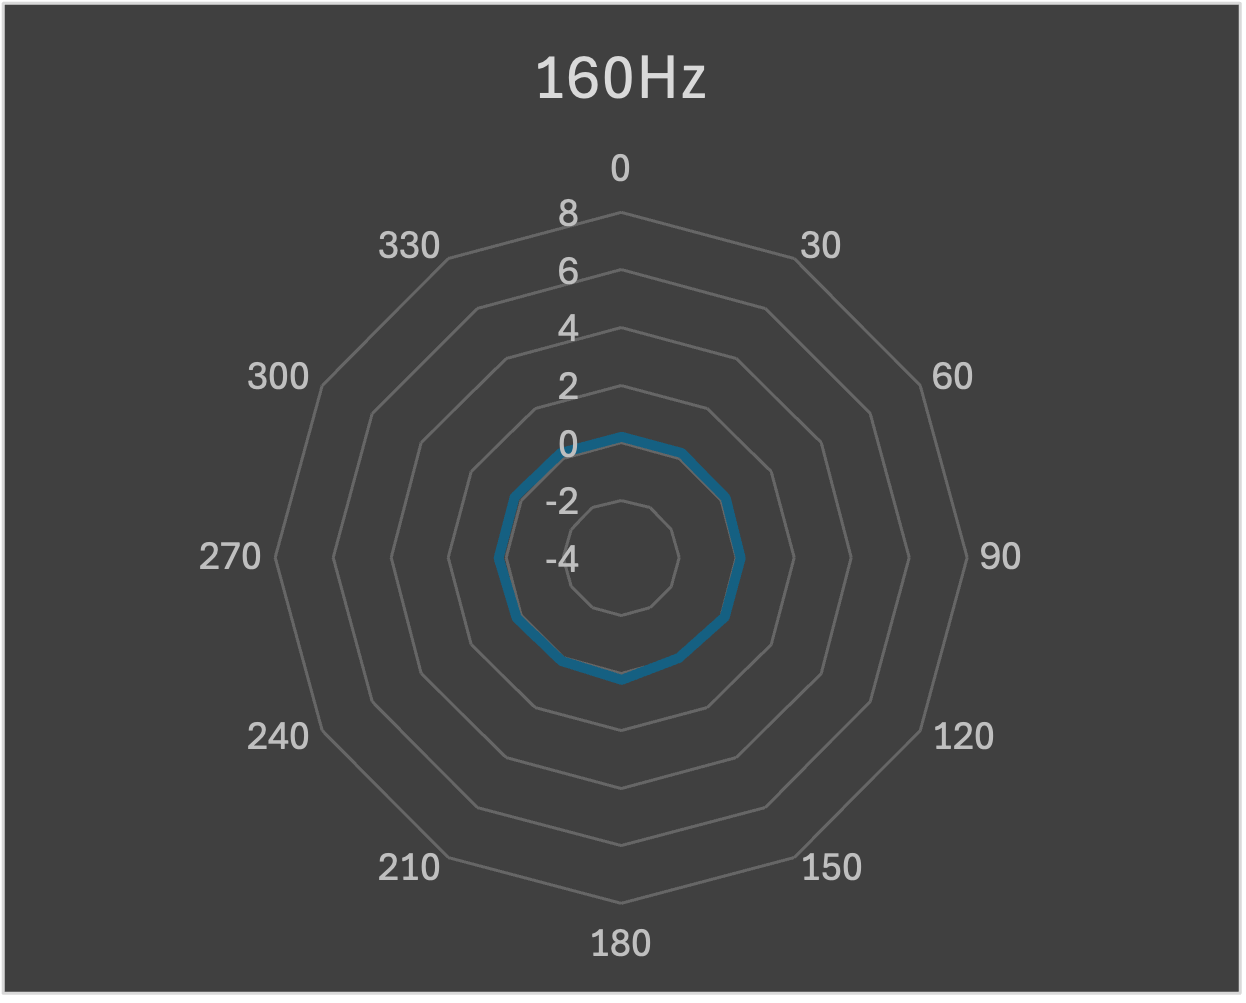
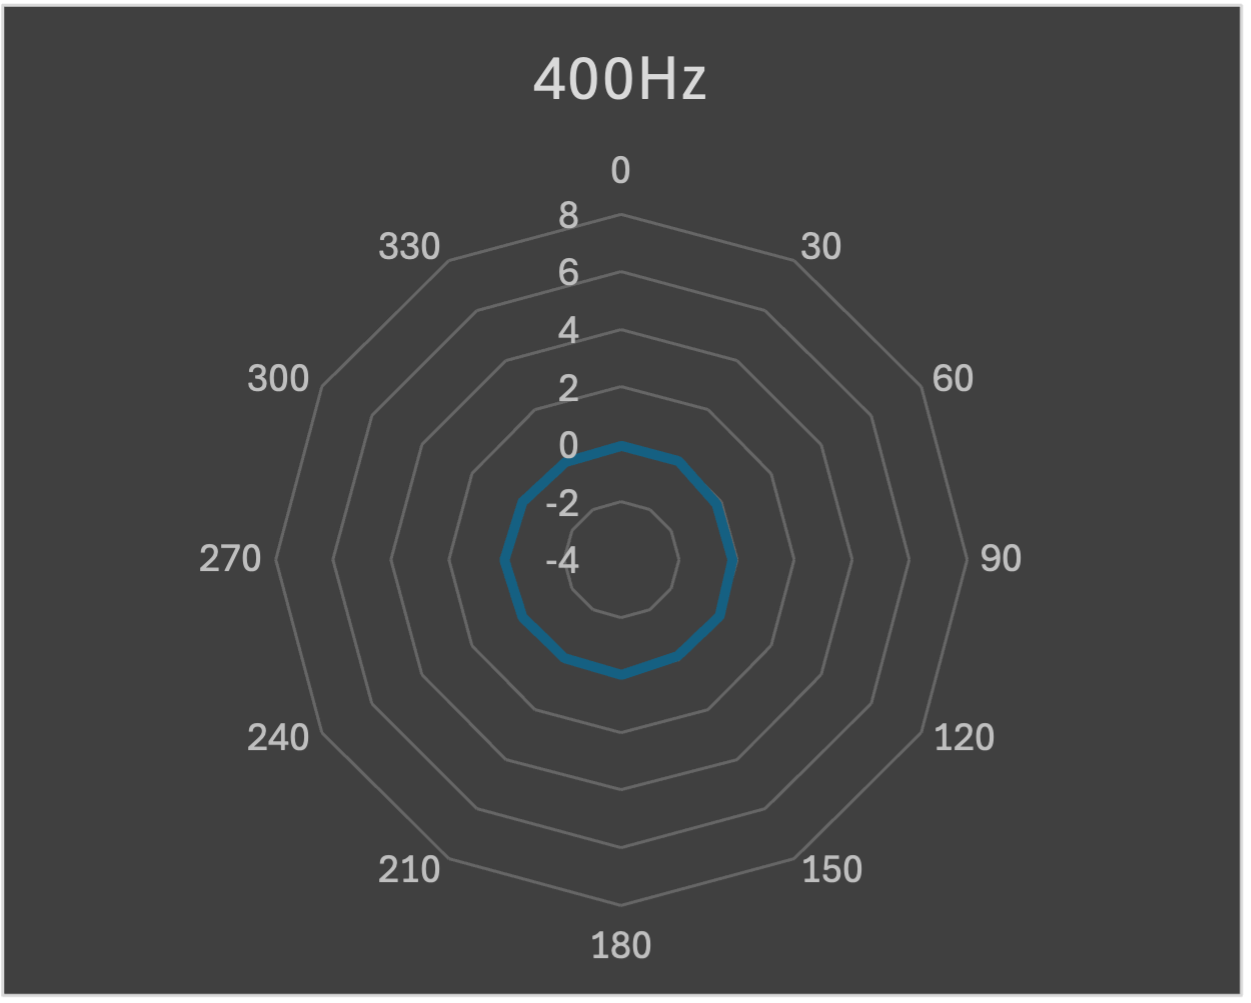
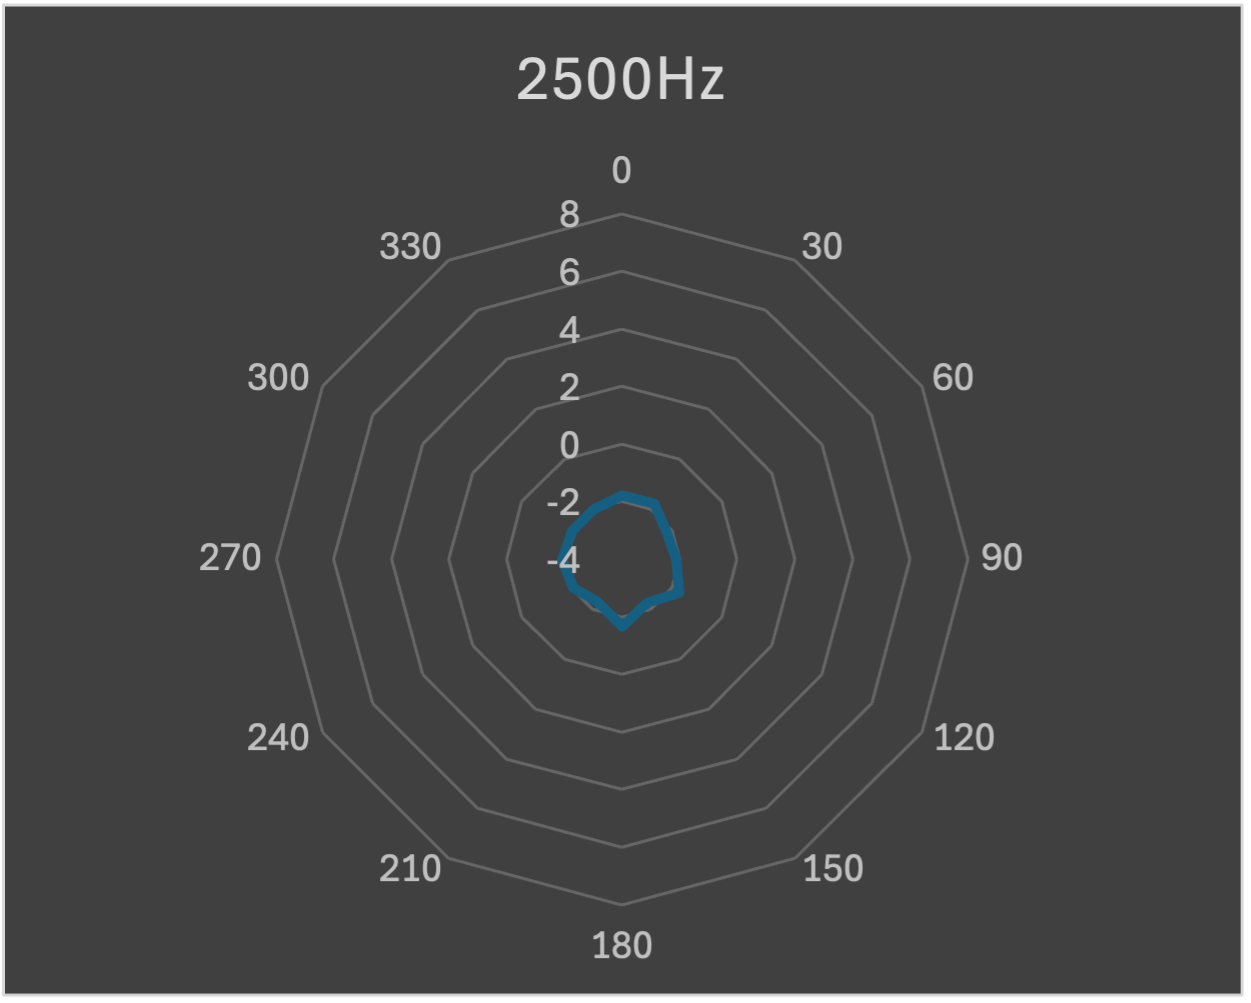
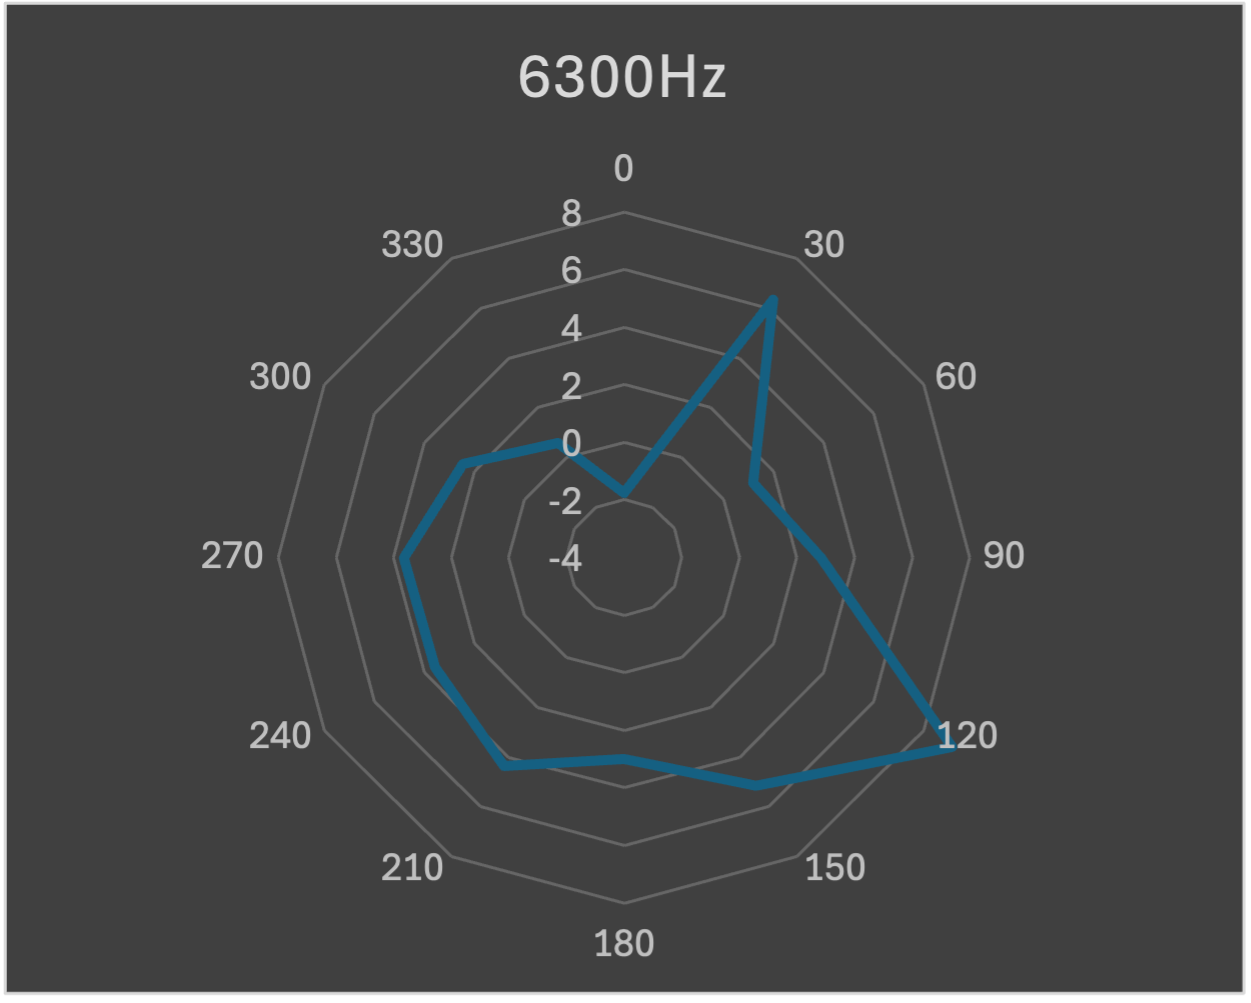
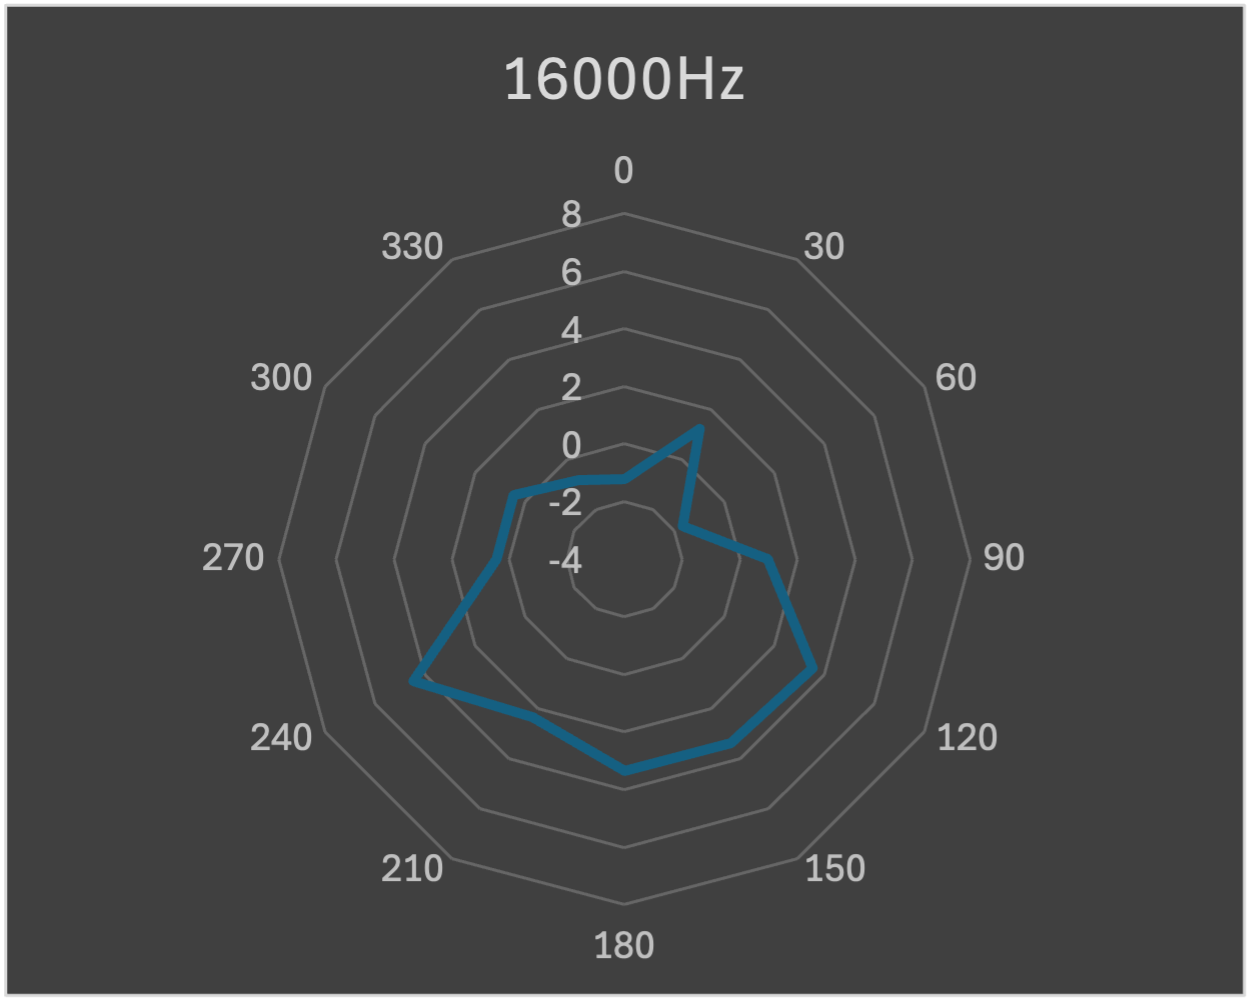
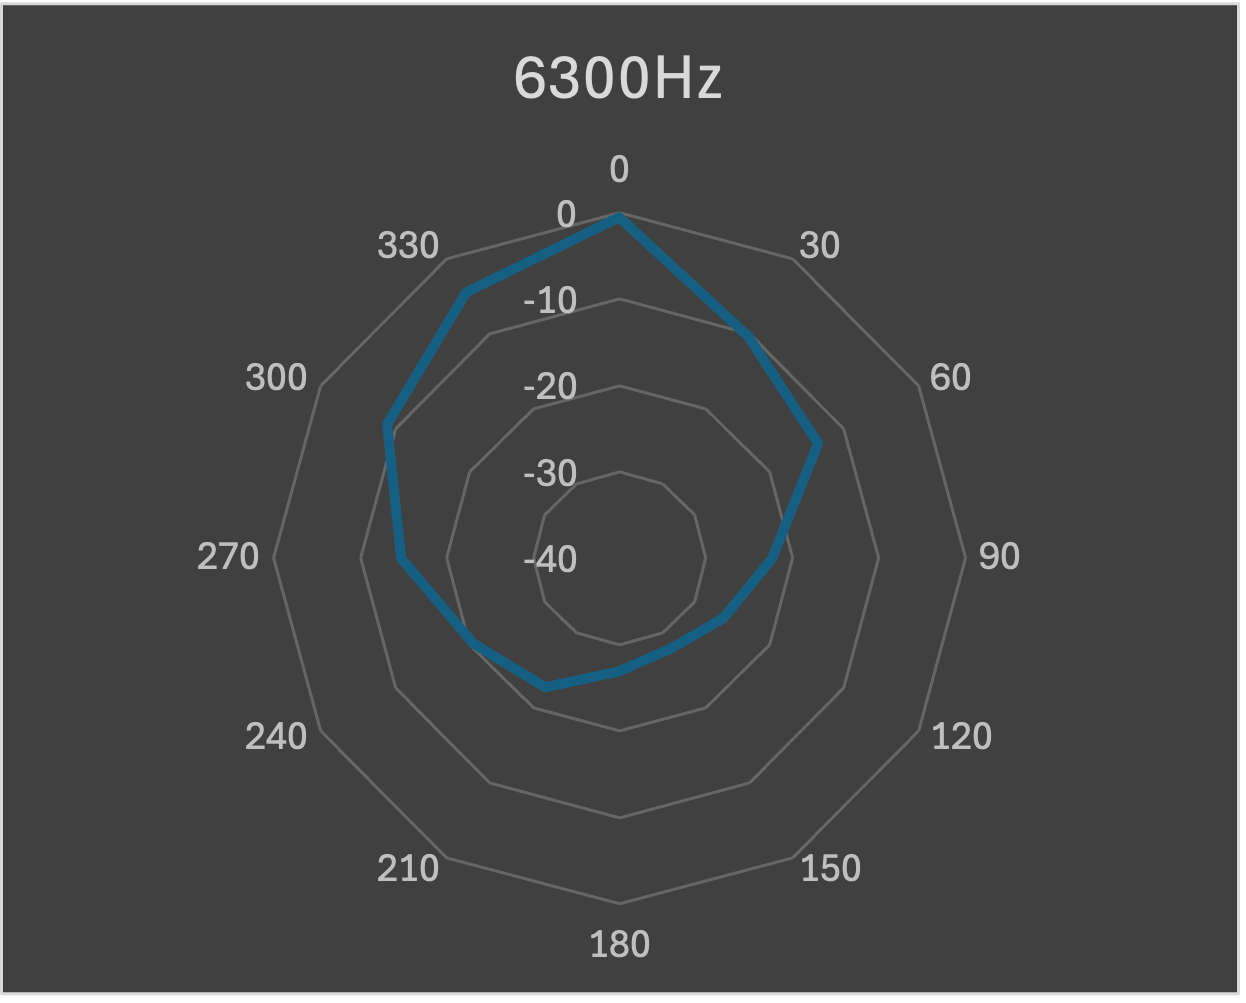
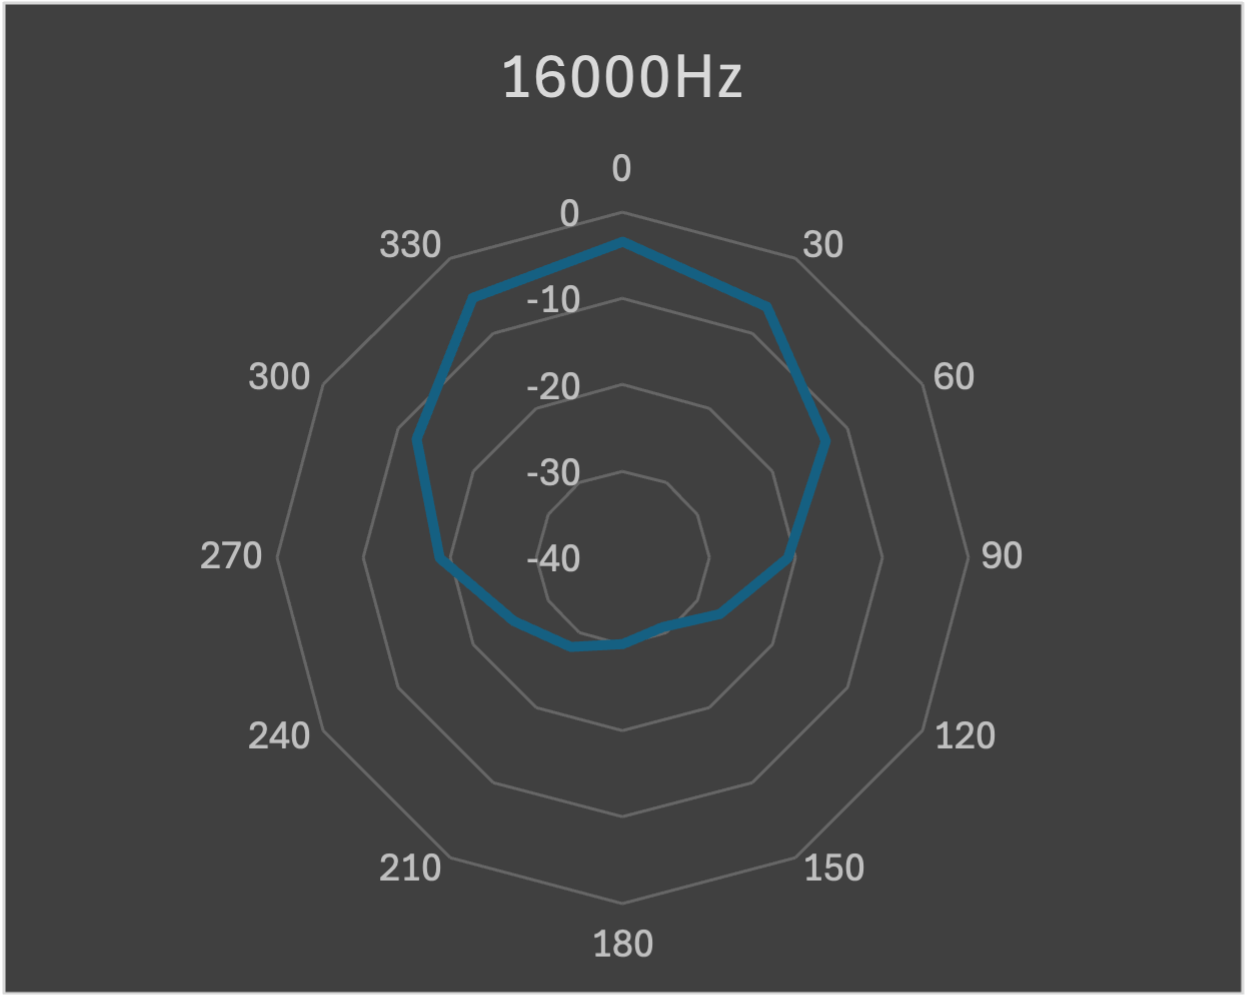
Kind of interested, there's bassicaly no change up till 6300Hz, where the dispersion really gets weird. Though again, intuitavely this makes sense, comparing the size of the dust caps to the respective frequencies we see being scatterd.
A neat experiment, but not particularly suprising results. They in fact make woofers without a dustcap, or that are "inverted". But with this knowledge, I would guess that dented subwoofers are still a worthwhile purchase, and those pop up for cheap at thrift stores pretty often. This is also all ignores the fact that there are many of techniques to pop them back out. The speaker used is unfourtanetly beyond repair, but I might consider turning the woofer into a subkick